Your energy. A smarter routine. Meet SmartApp 2.0 ↗

AmpByte SmartApp 2.0

Charge Smarter,
Pay Less.

Charge When Rates Drop.
Put Surplus Solar to Work.
Keep Home Power in Balance.

SmartApp brings electricity prices, charging schedules and household demand together—helping you charge at lower rates, use surplus solar and keep total household demand within your configured limit for safe charging.

Available on supported AmpByte chargers via Tuya Smart or Smart Life.

1. What is the charger doing?

2. Which plan and mode are active?

3. How much energy is this session using, and how much is it costing?

A solar-powered home with warm interior lighting and an electric vehicle charging in the driveway

SIX SMARTAPP FEATURES. SIX EVERYDAY GOALS.

What do you want
your next charge to do?

Start with your day. We’ll show you the SmartApp path.

Dynamic Rate: subscription, invited beta access and supported markets. Solar Only and app-based DLB: compatible meter and activated hardware required.

01 / ToU Rate Plan

See Your ToU Tariff.
Edit It by Touch.

THE SMARTAPP DIFFERENCE

Your own tariff becomes a 24-hour picture you can edit by touch.

Your Tariff. In Four Colors.

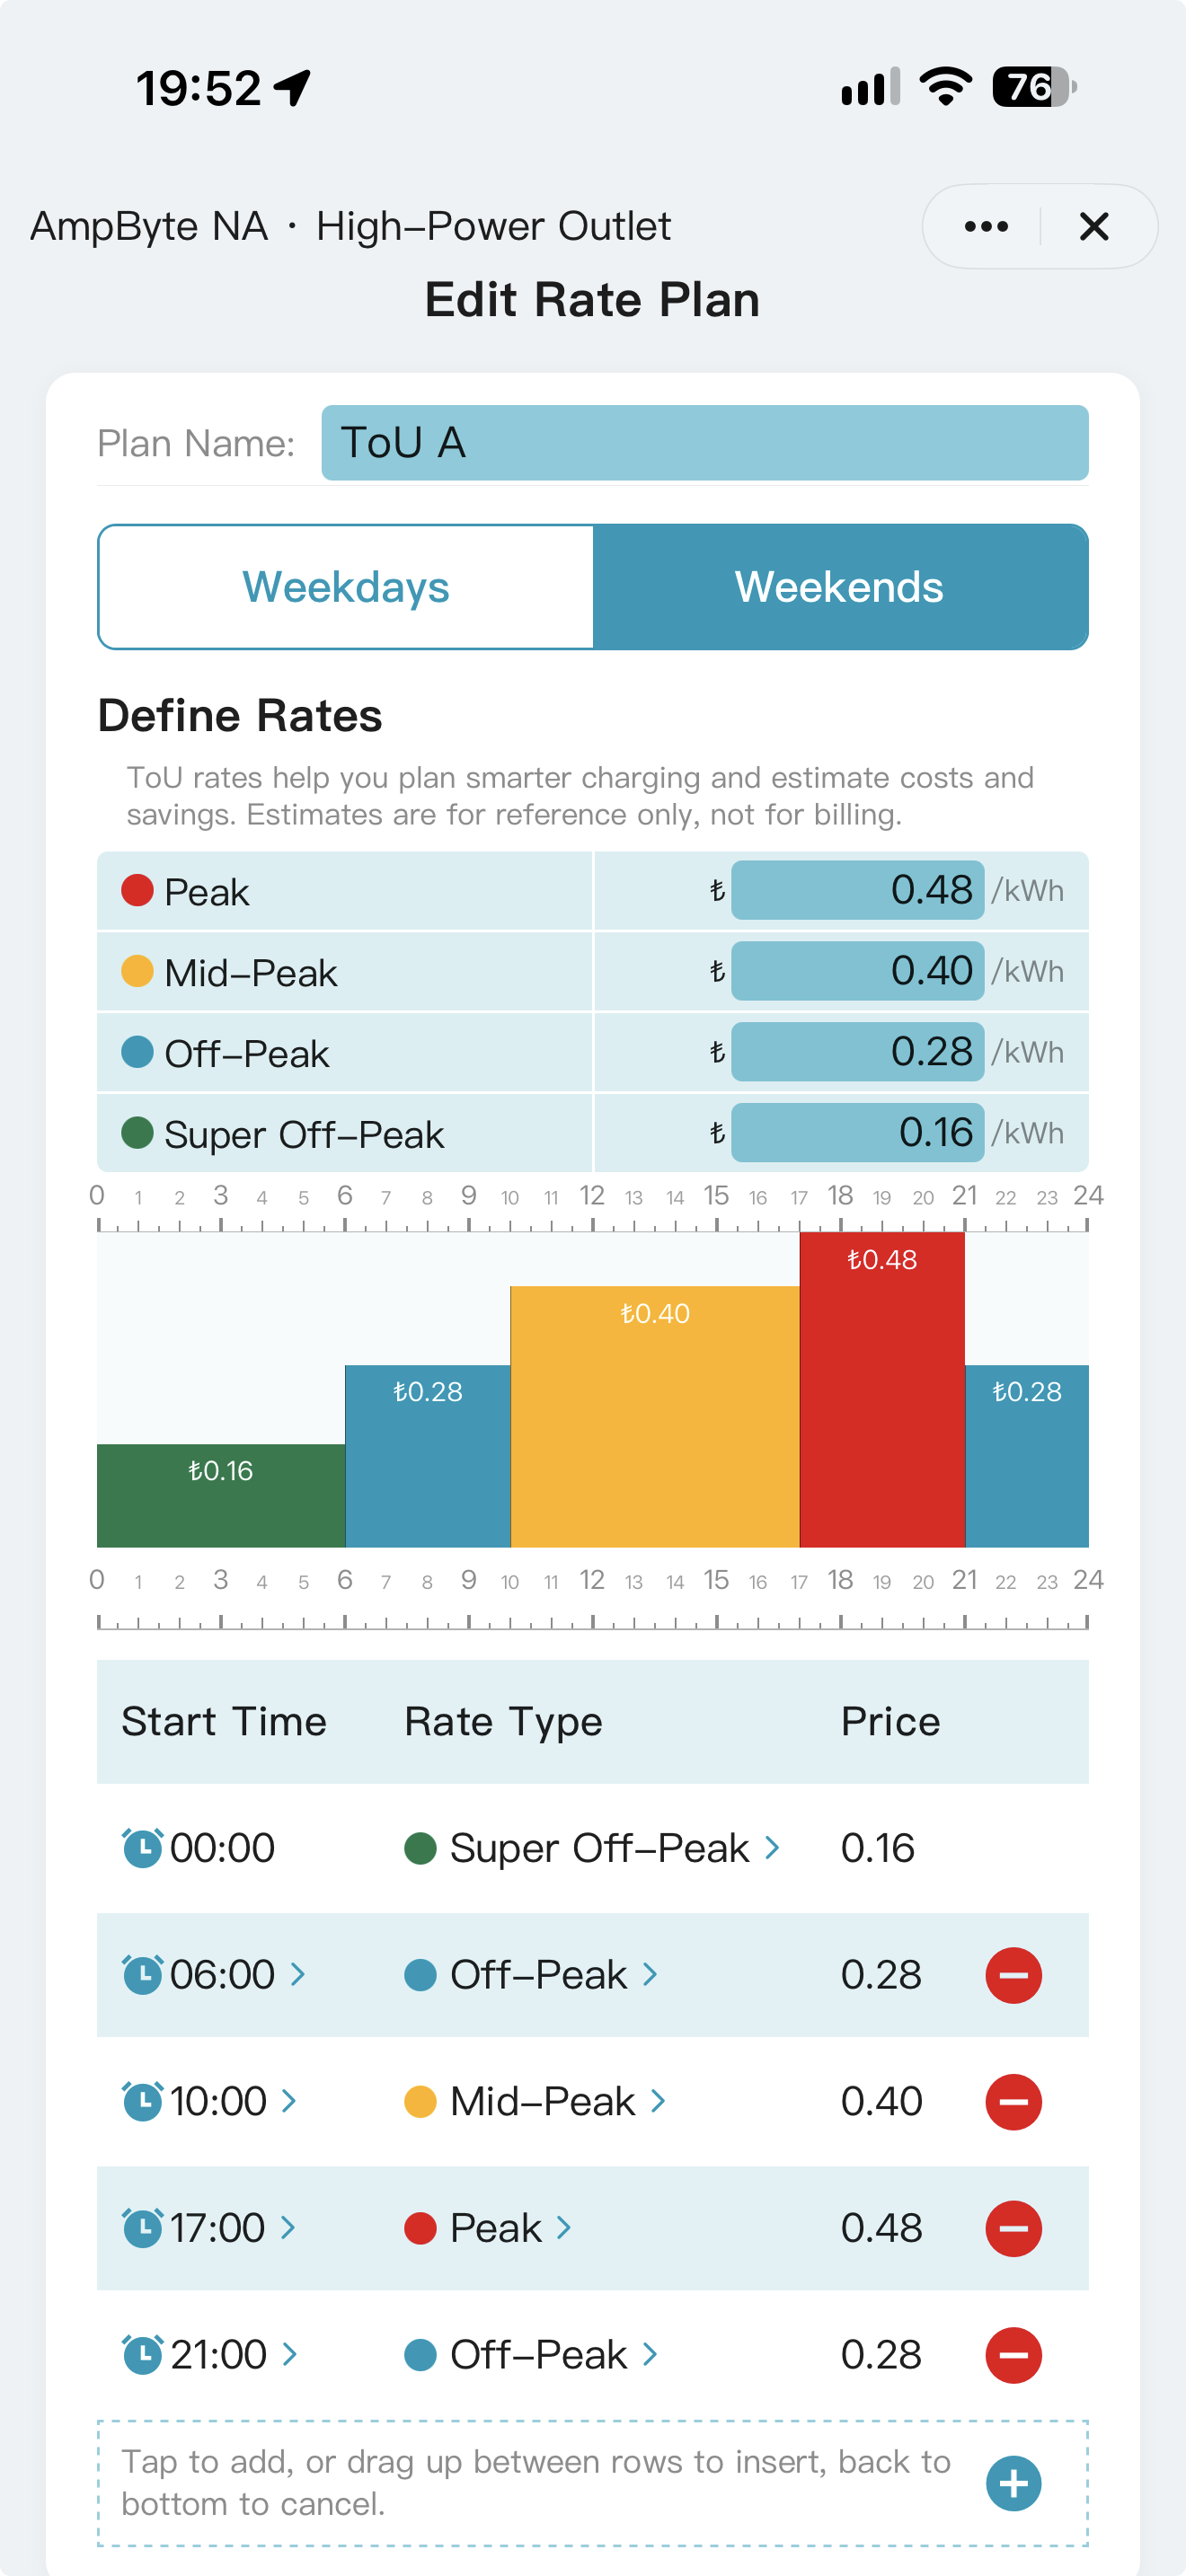
Turn your ToU tariffs into a color-coded 24-hour picture with just a few drags. Define your own prices for Peak, Mid-Peak, Off-Peak and Super Off-Peak.

Shape Your Day by Touch.

Drag the side edges of each block left or right to adjust its time period, and the top edge up or down to select the ToU rate type.

Weekdays and Weekends, Separately.

Create a Rate Plan for both day types to match your electricity contract. Name and select the plan you want to use.

Show me how in SmartApp +
  1. Settings → Rate Plan → choose a profile.
  2. Enter real prices and time periods for Weekdays and Weekends.
  3. Confirm the edit, then select and confirm the active plan.
Read the manual · page 6 ↗
What to know before you start

Timeline colors and cost estimates depend on the plan you enter. Update it when your tariff changes; estimates are for reference, not utility billing.

SmartApp Rate Plan editor with tariff prices, weekday and weekend tabs, and a 24-hour timeline
ToU Rate Plan · tap to view full size
Watch: Setting up a ToU plan · 28 sec

02 / Smart Schedule · Based on ToU Rates

Schedule by Touch.
Charge at Lower Rates.

THE SMARTAPP DIFFERENCE

See prices and charging periods together. Drag block edges to set time and current.

Price and Timing, Together.

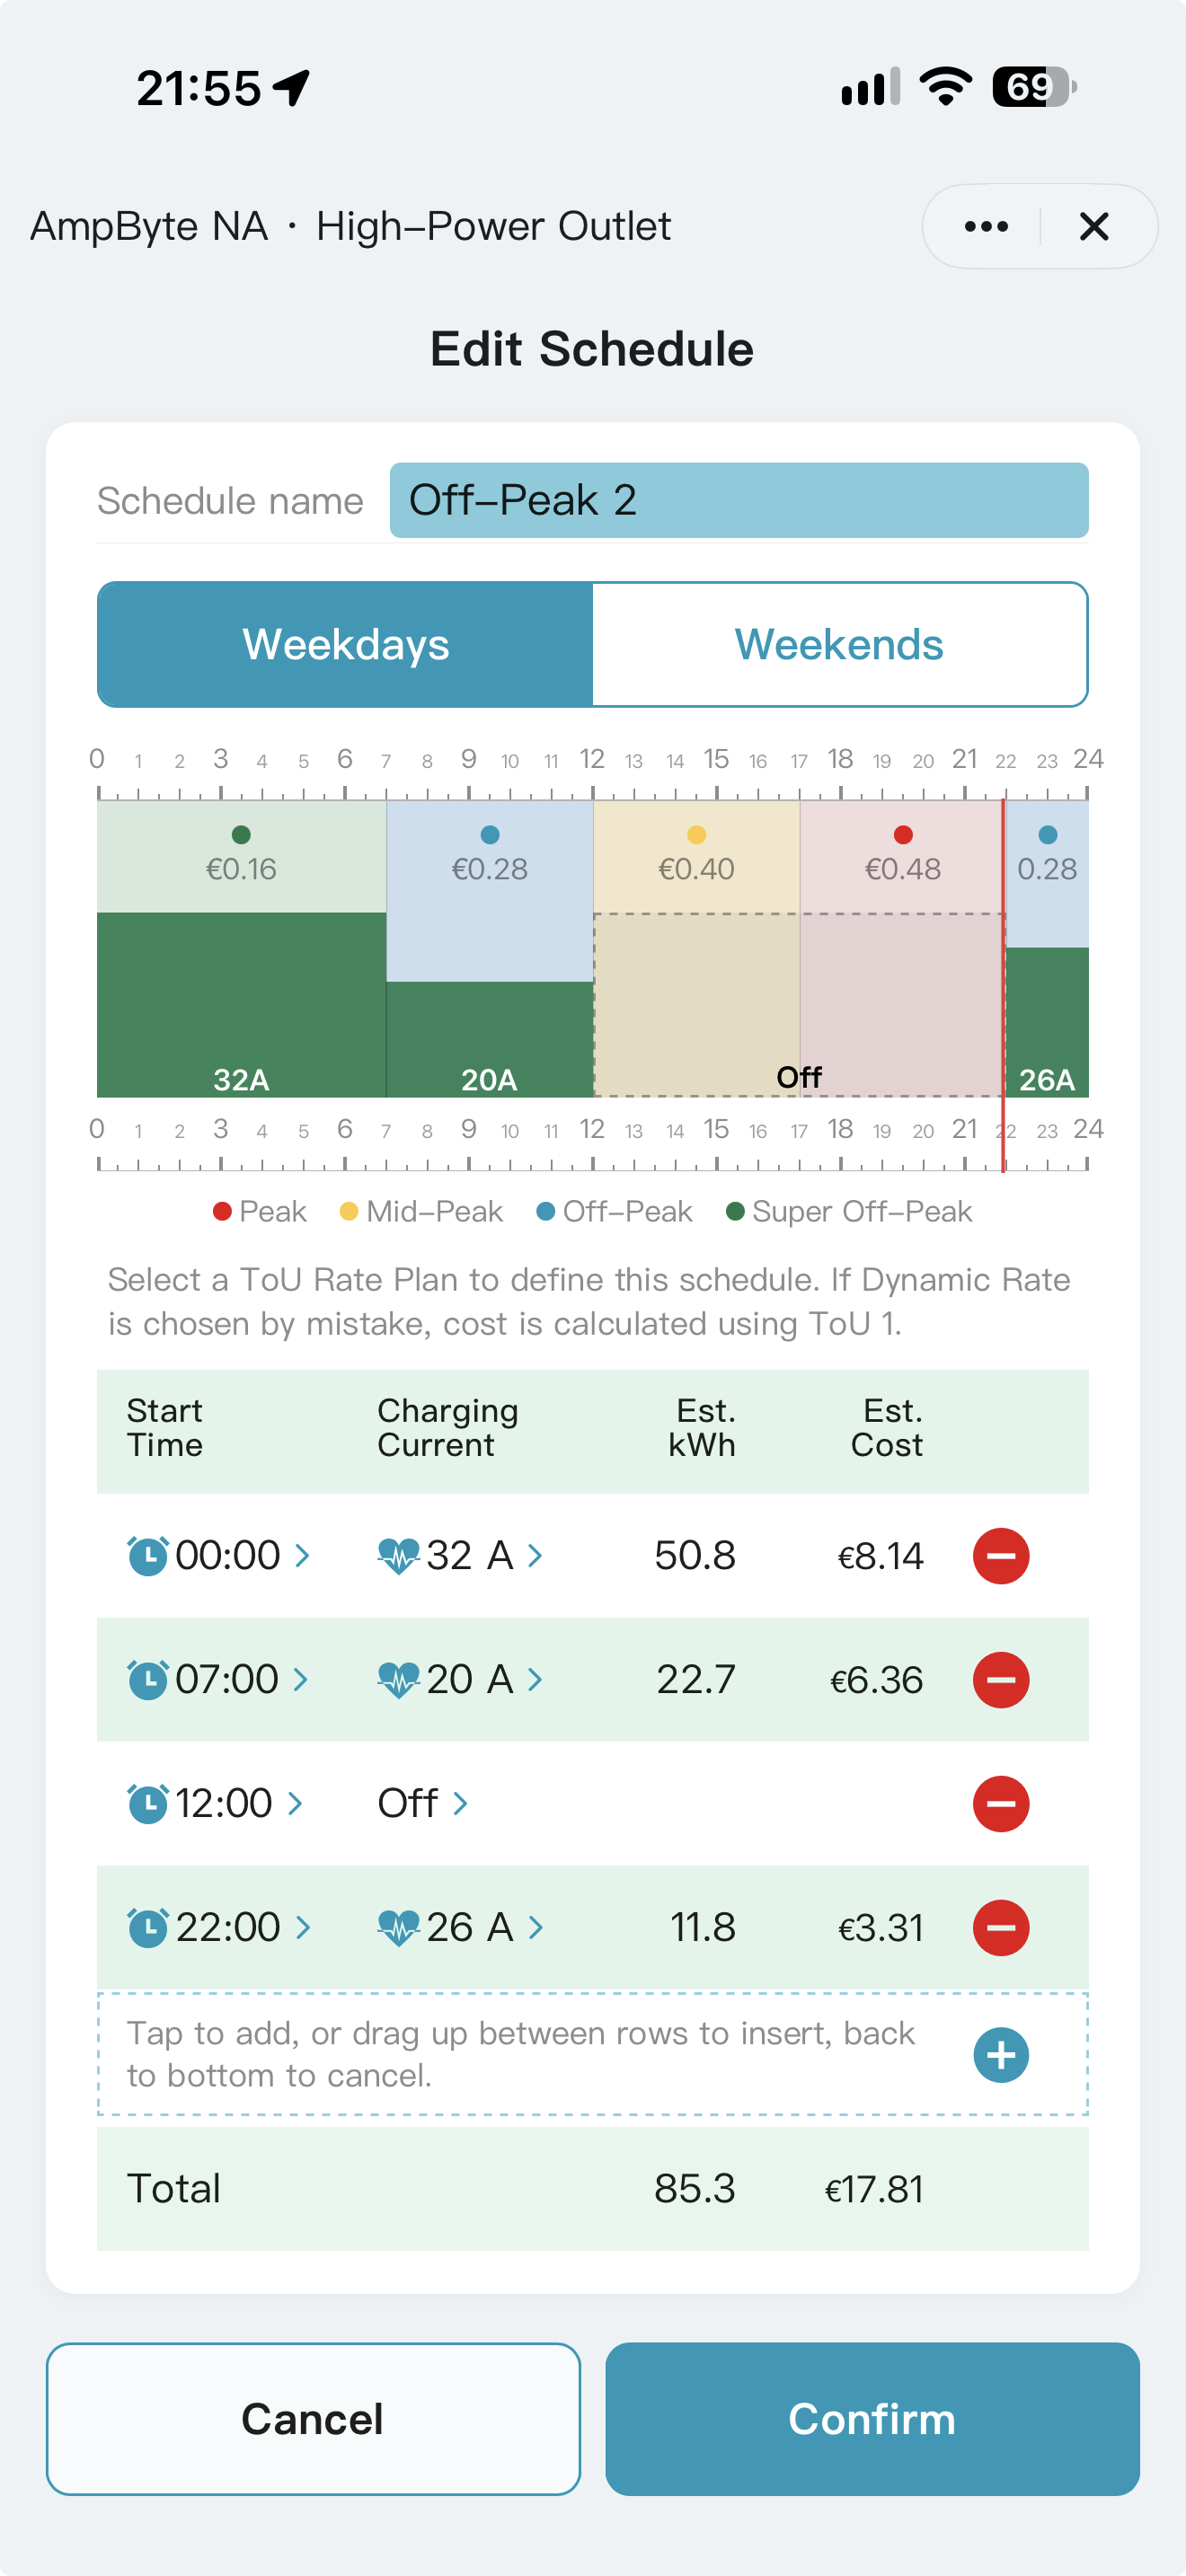
See your ToU price bands behind the charging schedule. Choose lower-rate windows for charging, with prices and timing in one clear chart.

Drag to Set Time and Current.

Drag each charging block’s side edges left or right with your finger to set its start and stop times. Drag the top edge up or down to set the charging current.

A Routine That Fits Your Week.

Save separate weekday and weekend schedules. With Scheduled selected and your EV connected, your charger follows the routine you have chosen.

Show me how in SmartApp +
  1. Settings → Smart Schedule → edit a profile.
  2. Add ON events and permitted currents, then OFF events; save both day types.
  3. Home → Charging Mode → Scheduled → select the schedule → Confirm.
Read the manual · page 7 ↗
What to know before you start

Leave the charger powered and the EV connected. Use one scheduler: if the car and SmartApp both have schedules, their windows must overlap.

SmartApp Smart Schedule showing charging events over a color-coded tariff timeline
Smart Schedule · tap to view full size
Watch: Building a Smart Schedule · 27 sec

03 / Dynamic Rate

Catch Cheapest Hours.
Save Automatically.

THE SMARTAPP DIFFERENCE

Set a visible price limit. Let Eco Charge follow the changing tariff.

See the Prices Ahead.

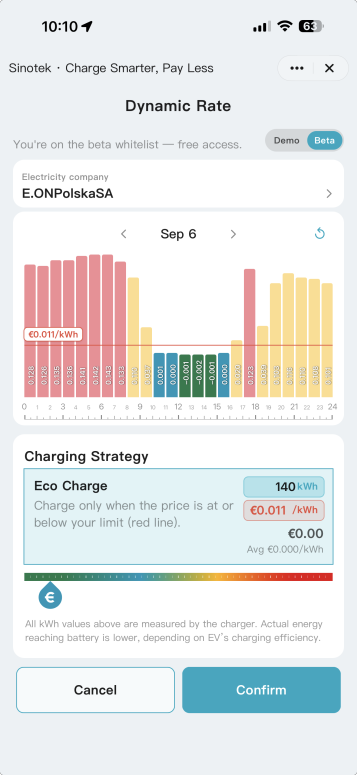
Connect your supported electricity provider and dynamic tariff. View the latest available prices up to three days ahead to spot lower-rate periods.

Your Price Limit. In Plain Sight.

Drag the red line on the price chart to set your limit. Fine-tune your charging strategy around the rate you are willing to pay.

Eco Charge Follows the Price.

With Eco Charge confirmed and your EV connected, charging starts automatically when the rate is at or below your chosen limit.

Show me how in SmartApp +
  1. Open Rate Plan → Dynamic.
  2. Enter location and choose the supported electricity provider and market; save to load rates.
  3. Adjust the red price threshold and confirm the strategy.
Read the manual · page 8 ↗
Supported markets · subscription / limited access

The supplied manual describes a paid subscription feature currently open to selected beta testers. Availability depends on country, provider, account and activated product. Data is supplied through Tuya’s Conow Labs from third-party sources; check rates, currency and any exchange-rate setting.


SmartApp Dynamic Rate chart with a red charging price threshold and charging strategy controls
Dynamic Rate · tap to view full size
Watch: Choosing a Dynamic Rate charging strategy · 20 sec

04 / Solar Only Charging

From your roof.
To your road.

THE SMARTAPP DIFFERENCE

When your Smart Meter detects surplus solar flowing to the grid, Solar Only redirects it to your EV—so you use your sunshine instead of selling it cheaply.

Keep More of Your Sunshine.

Your rooftop solar supplies your home first. Send surplus energy to your EV instead of exporting it at a low feed-in rate, reducing the electricity you buy for charging.

Surplus Available. Charging Begins.

A compatible smart meter tracks power flowing to and from the grid. With Solar Only selected and your EV connected, charging starts when enough surplus is available.

Charging That Follows the Sunshine.

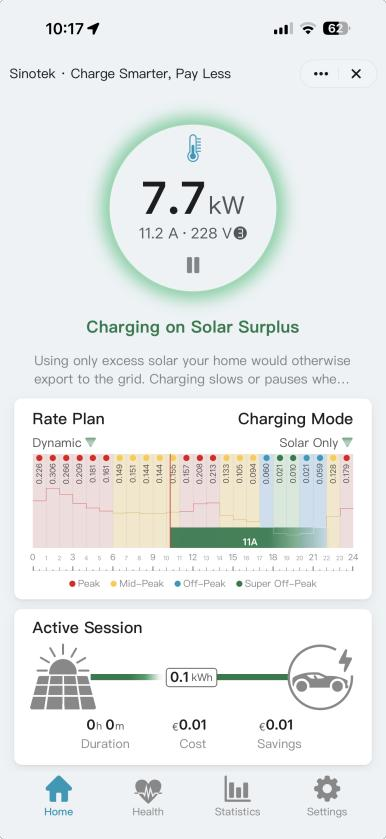
SmartApp adjusts charging current as solar output and household demand change. Make use of spare sunshine throughout the day without setting a fixed charging schedule.

Show me how in SmartApp +
  1. Install the specified meter on the main incoming supply and add it to Tuya.
  2. Settings → General → Smart Meter → bind it to the charger.
  3. Home → Charging Mode → Solar Only → Confirm, then connect the EV.
Read the manual · page 9 ↗
Compatible smart meter required

Requires compatible meter, charger, firmware and feature activation. Solar Only favors surplus; it does not guarantee zero grid use. The manual describes stopping after grid draw reaches 3 A or more for over 30 minutes, or after the meter remains offline for 10 minutes.

SmartApp Solar Only Home screen showing charging on solar surplus
Solar Only Charging · tap to view full size
Watch: Starting Solar Only charging · 17 sec

05 / Dynamic Load Balancing (DLB)

Home Comes First.
EV Charging Adapts.

THE SMARTAPP DIFFERENCE

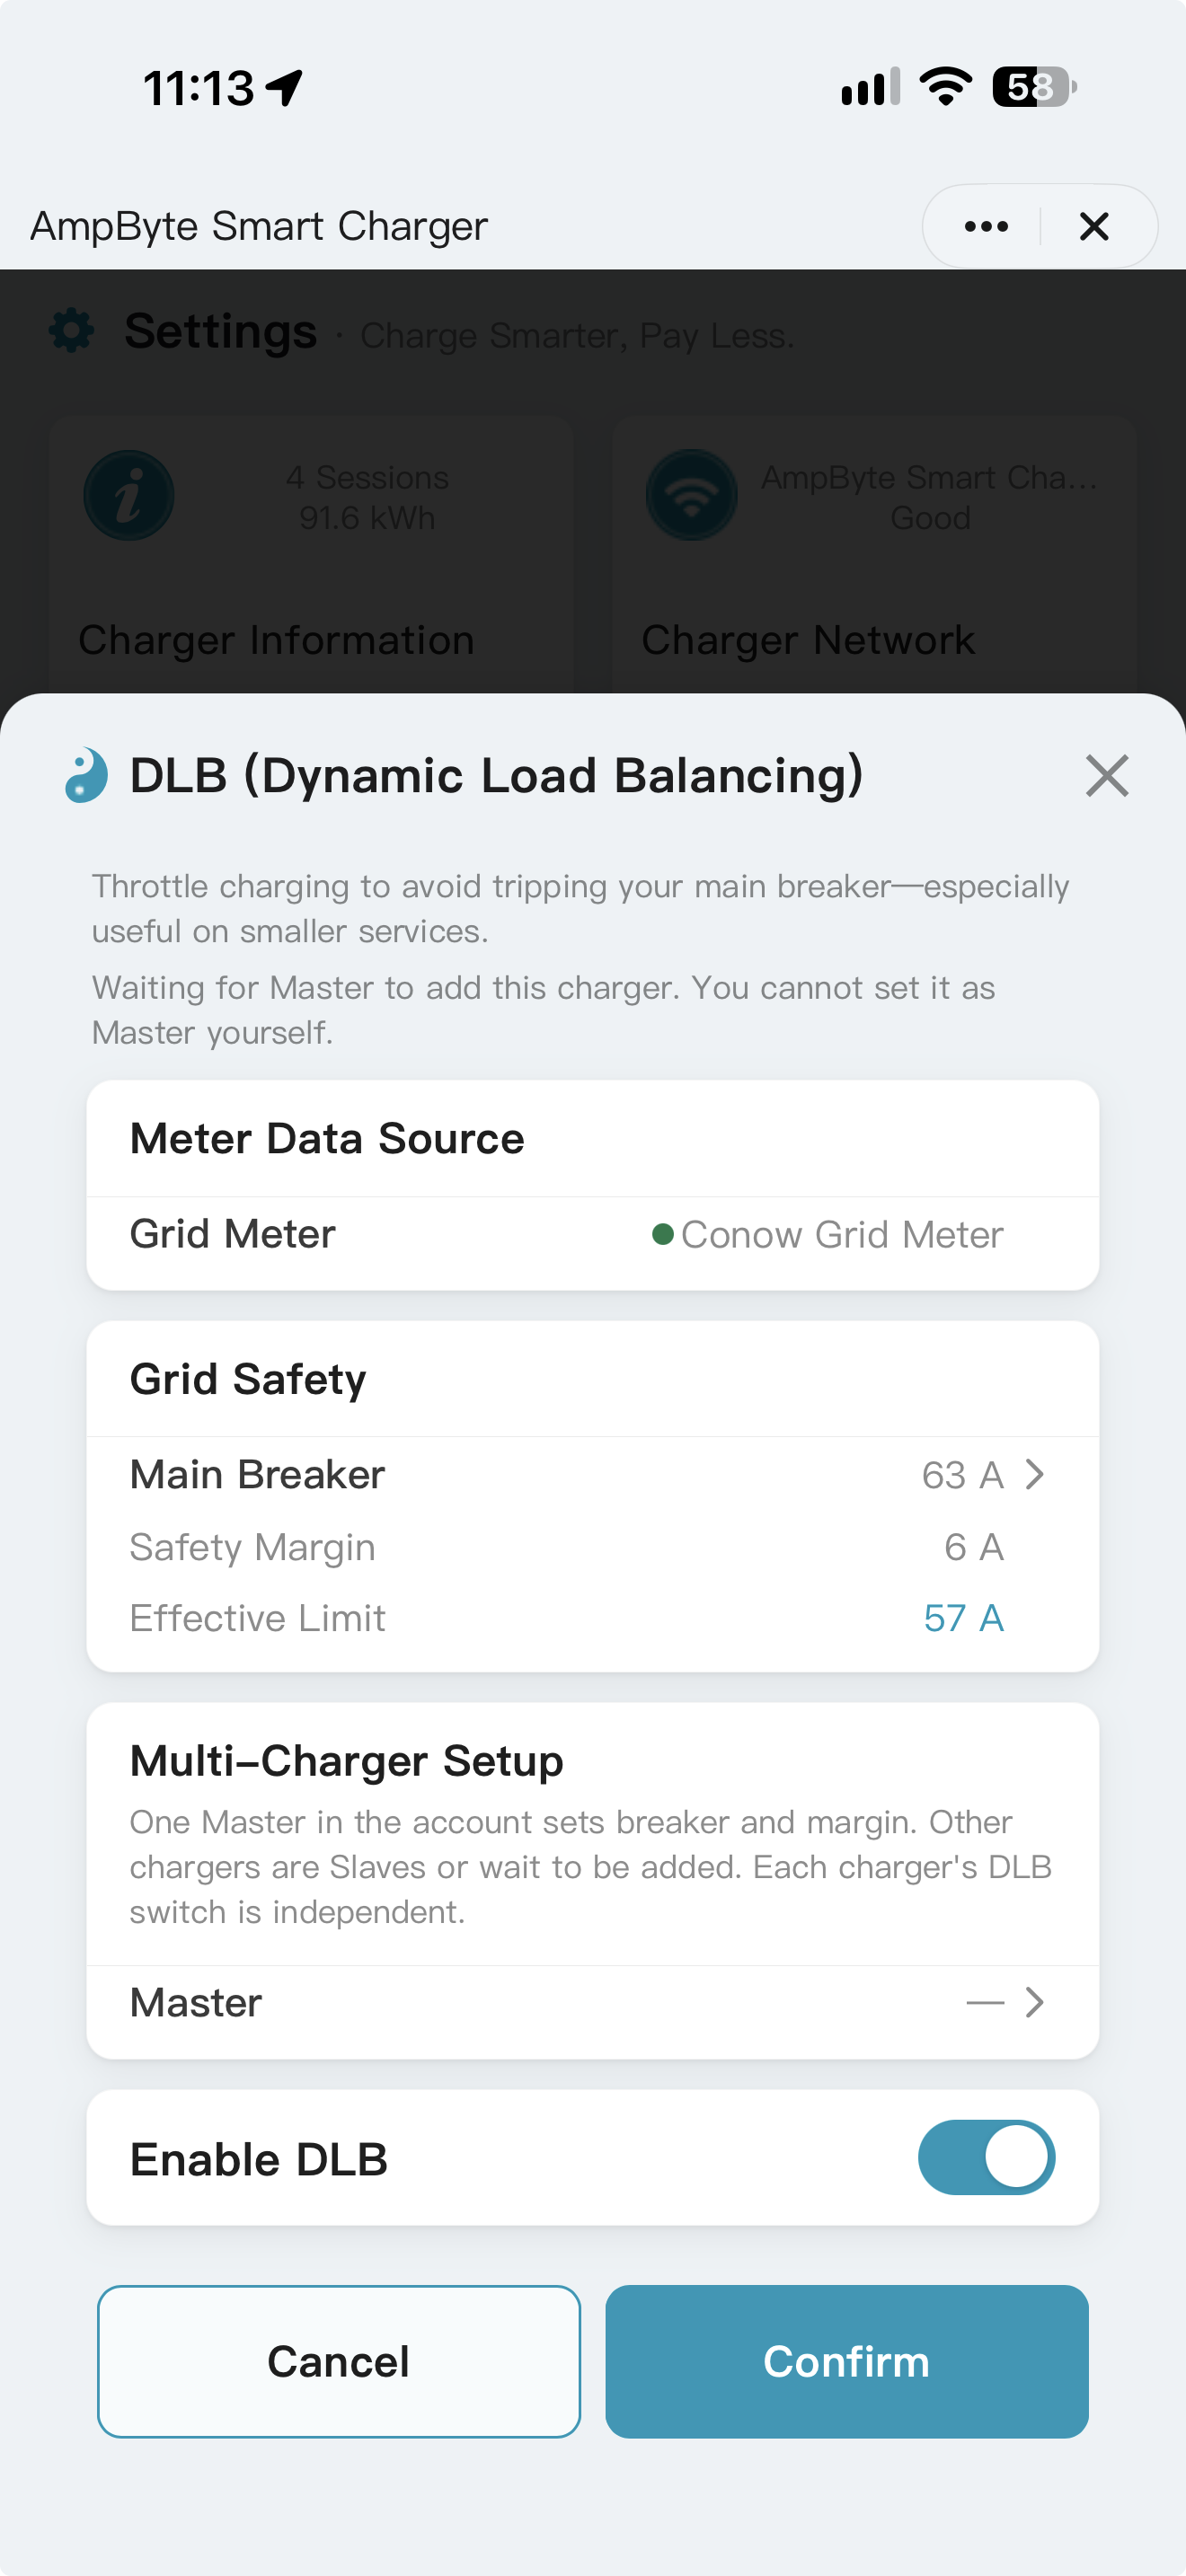
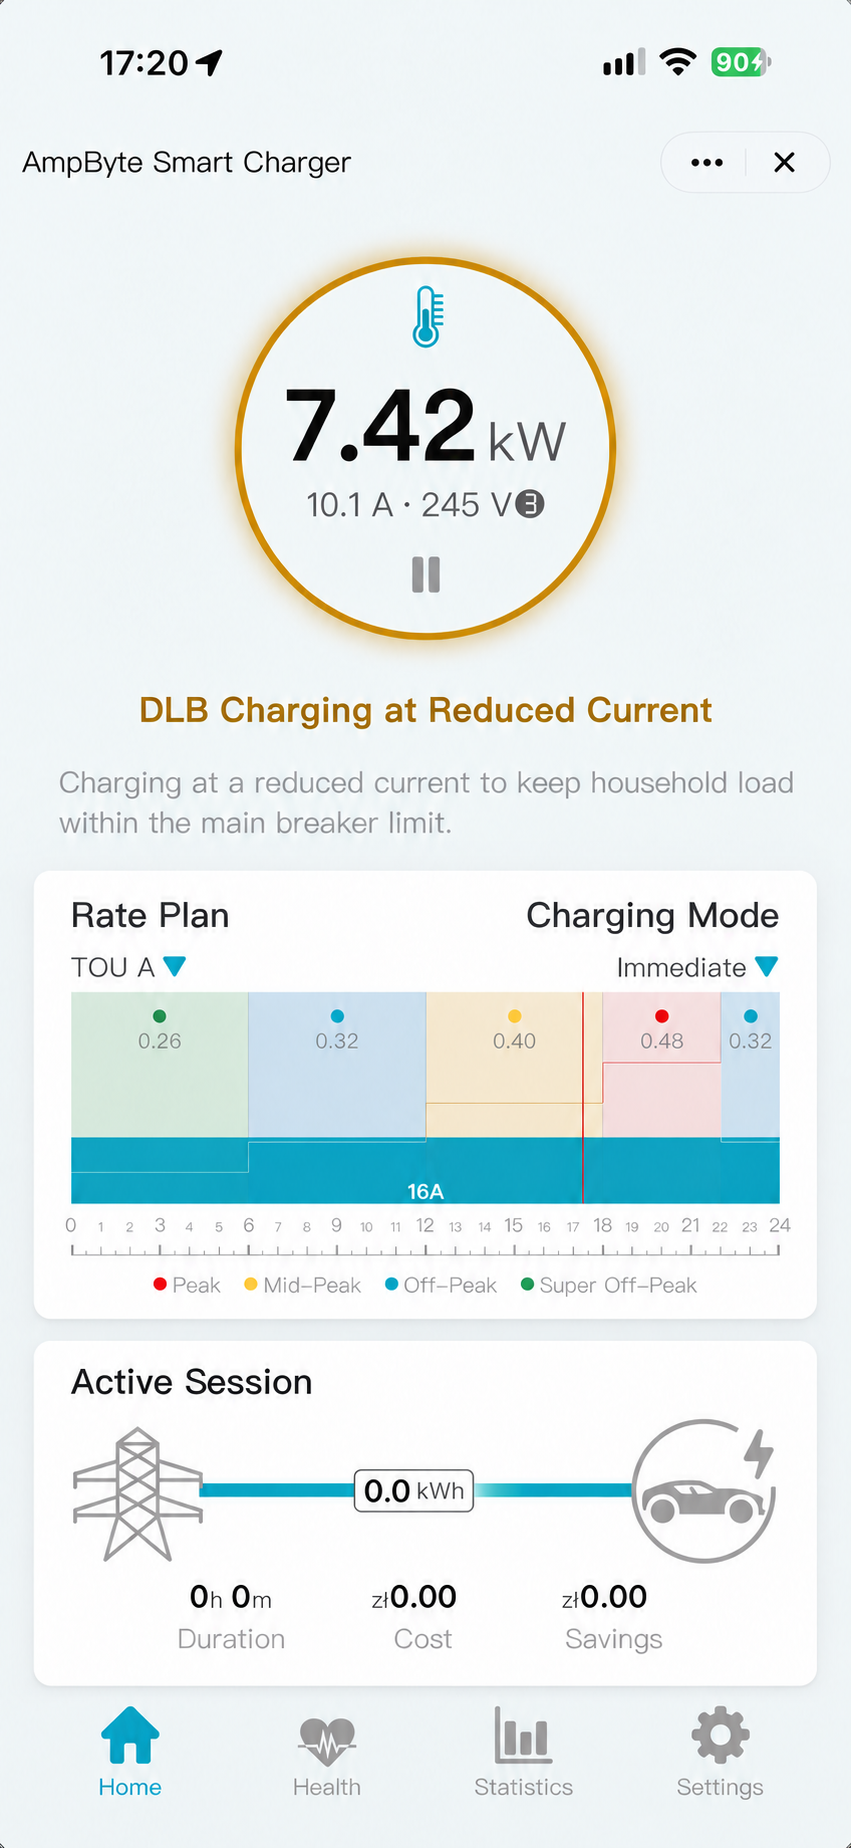
The smart meter tracks household demand. Your charger automatically slows down when your home needs more power and speeds up as demand falls—keeping total demand within your configured limit.

Stay Within Your Configured Limit.

Set the supply limit from your main breaker’s current rating. The system applies a safety margin to define the capacity available for your home and EV charging.

Home Demand Changes. Charging Responds.

A compatible smart meter tracks household demand. Your charger reduces current as appliances draw more power, then increases it as capacity becomes available.

One Home. Up to Three Chargers.

Supported setups connect one Master and up to two Slaves. They share the Master’s configured supply limit to balance charging within the available capacity.

Show me how in SmartApp +
  1. Bind a compatible meter on the home’s main incoming supply.
  2. Settings → Dynamic Load Balancing → enter the main breaker rating.
  3. For supported multi-charger setups, assign Master / Slave roles and confirm.
Read the manual · page 10 ↗
Compatible smart meter required

Requires compatible metering, correct installation settings and activated products. DLB manages available current; it does not replace wiring, breaker sizing or required protection. The standalone DLB-A1 monitor is a different system and is not managed in SmartApp.

SmartApp Dynamic Load Balancing settings showing the grid meter, main breaker, safety margin, effective limit, multi-charger setup and Enable DLB switch
Dynamic Load Balancing (DLB) · tap to view full size
DLB charging at reduced current: 10.1 A and 7.42 kW
Automatic current adjustment · tap to view full size

06 / Visualised Statistics

See your energy.
Track your savings.

THE SMARTAPP DIFFERENCE

Energy, estimated cost and savings together—compare each session and see the bigger picture over time.

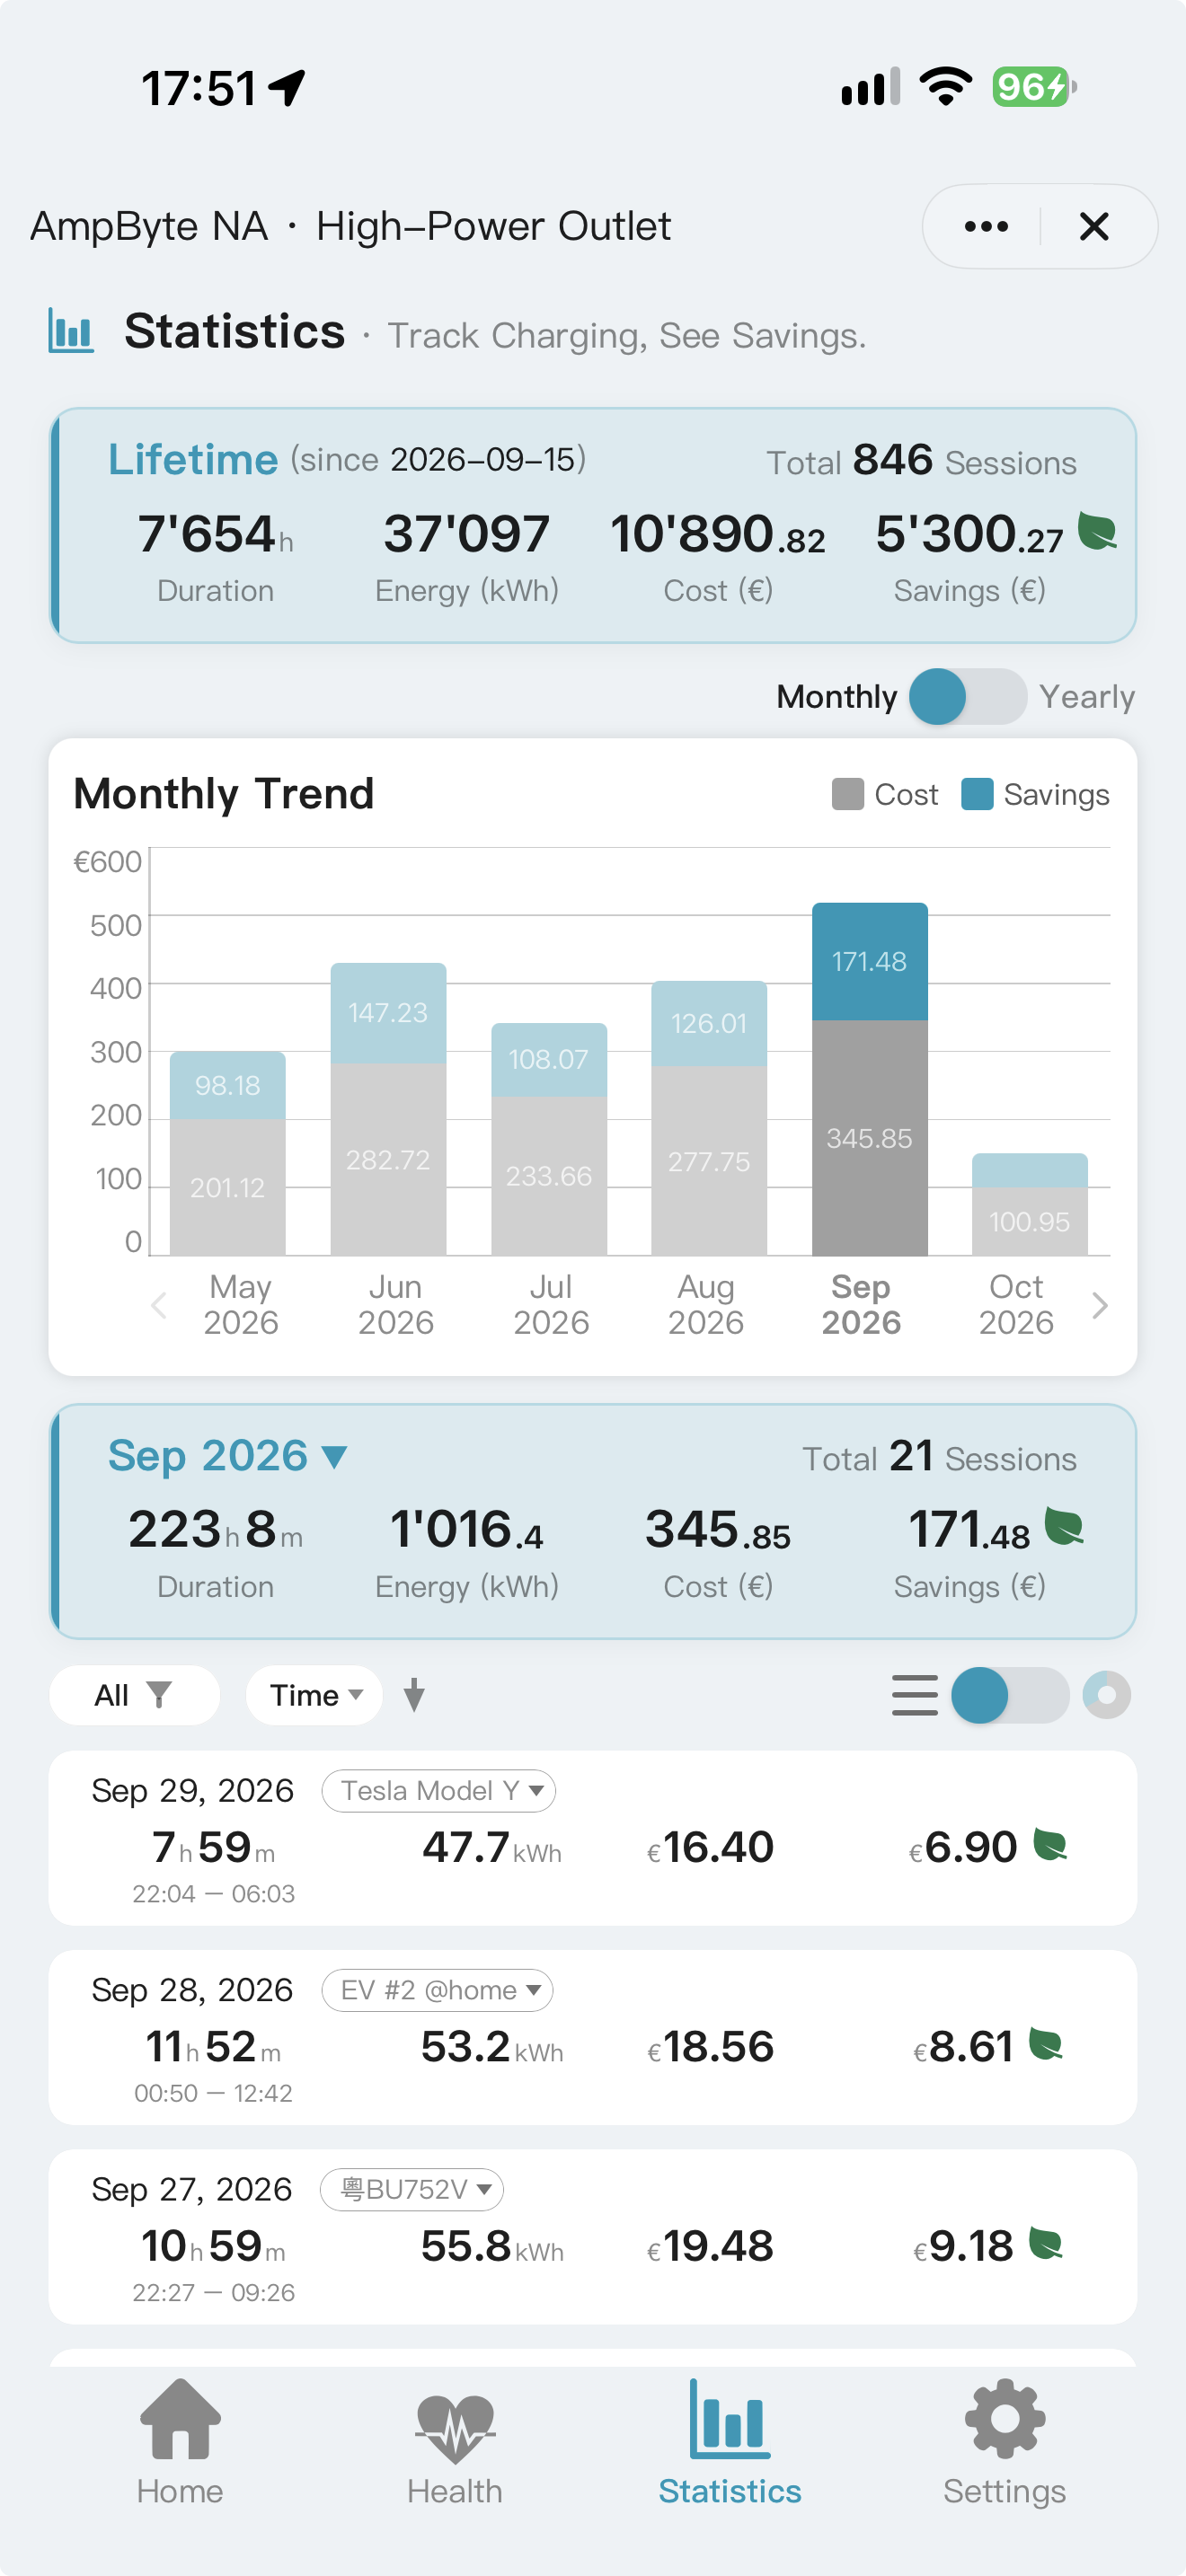
SmartApp energy, cost and savings statistics

MONTHLY VIEW

Every Charge.
Every Detail.

See your monthly totals, then explore each charging session—duration, energy, estimated cost and savings, with vehicle tags to keep your records organised.

Keep every session on record

Remove the EV connector while the charger is still powered and online. Wait for the record to upload before disconnecting supply power. Cost and savings are estimates based on your Rate Plan.

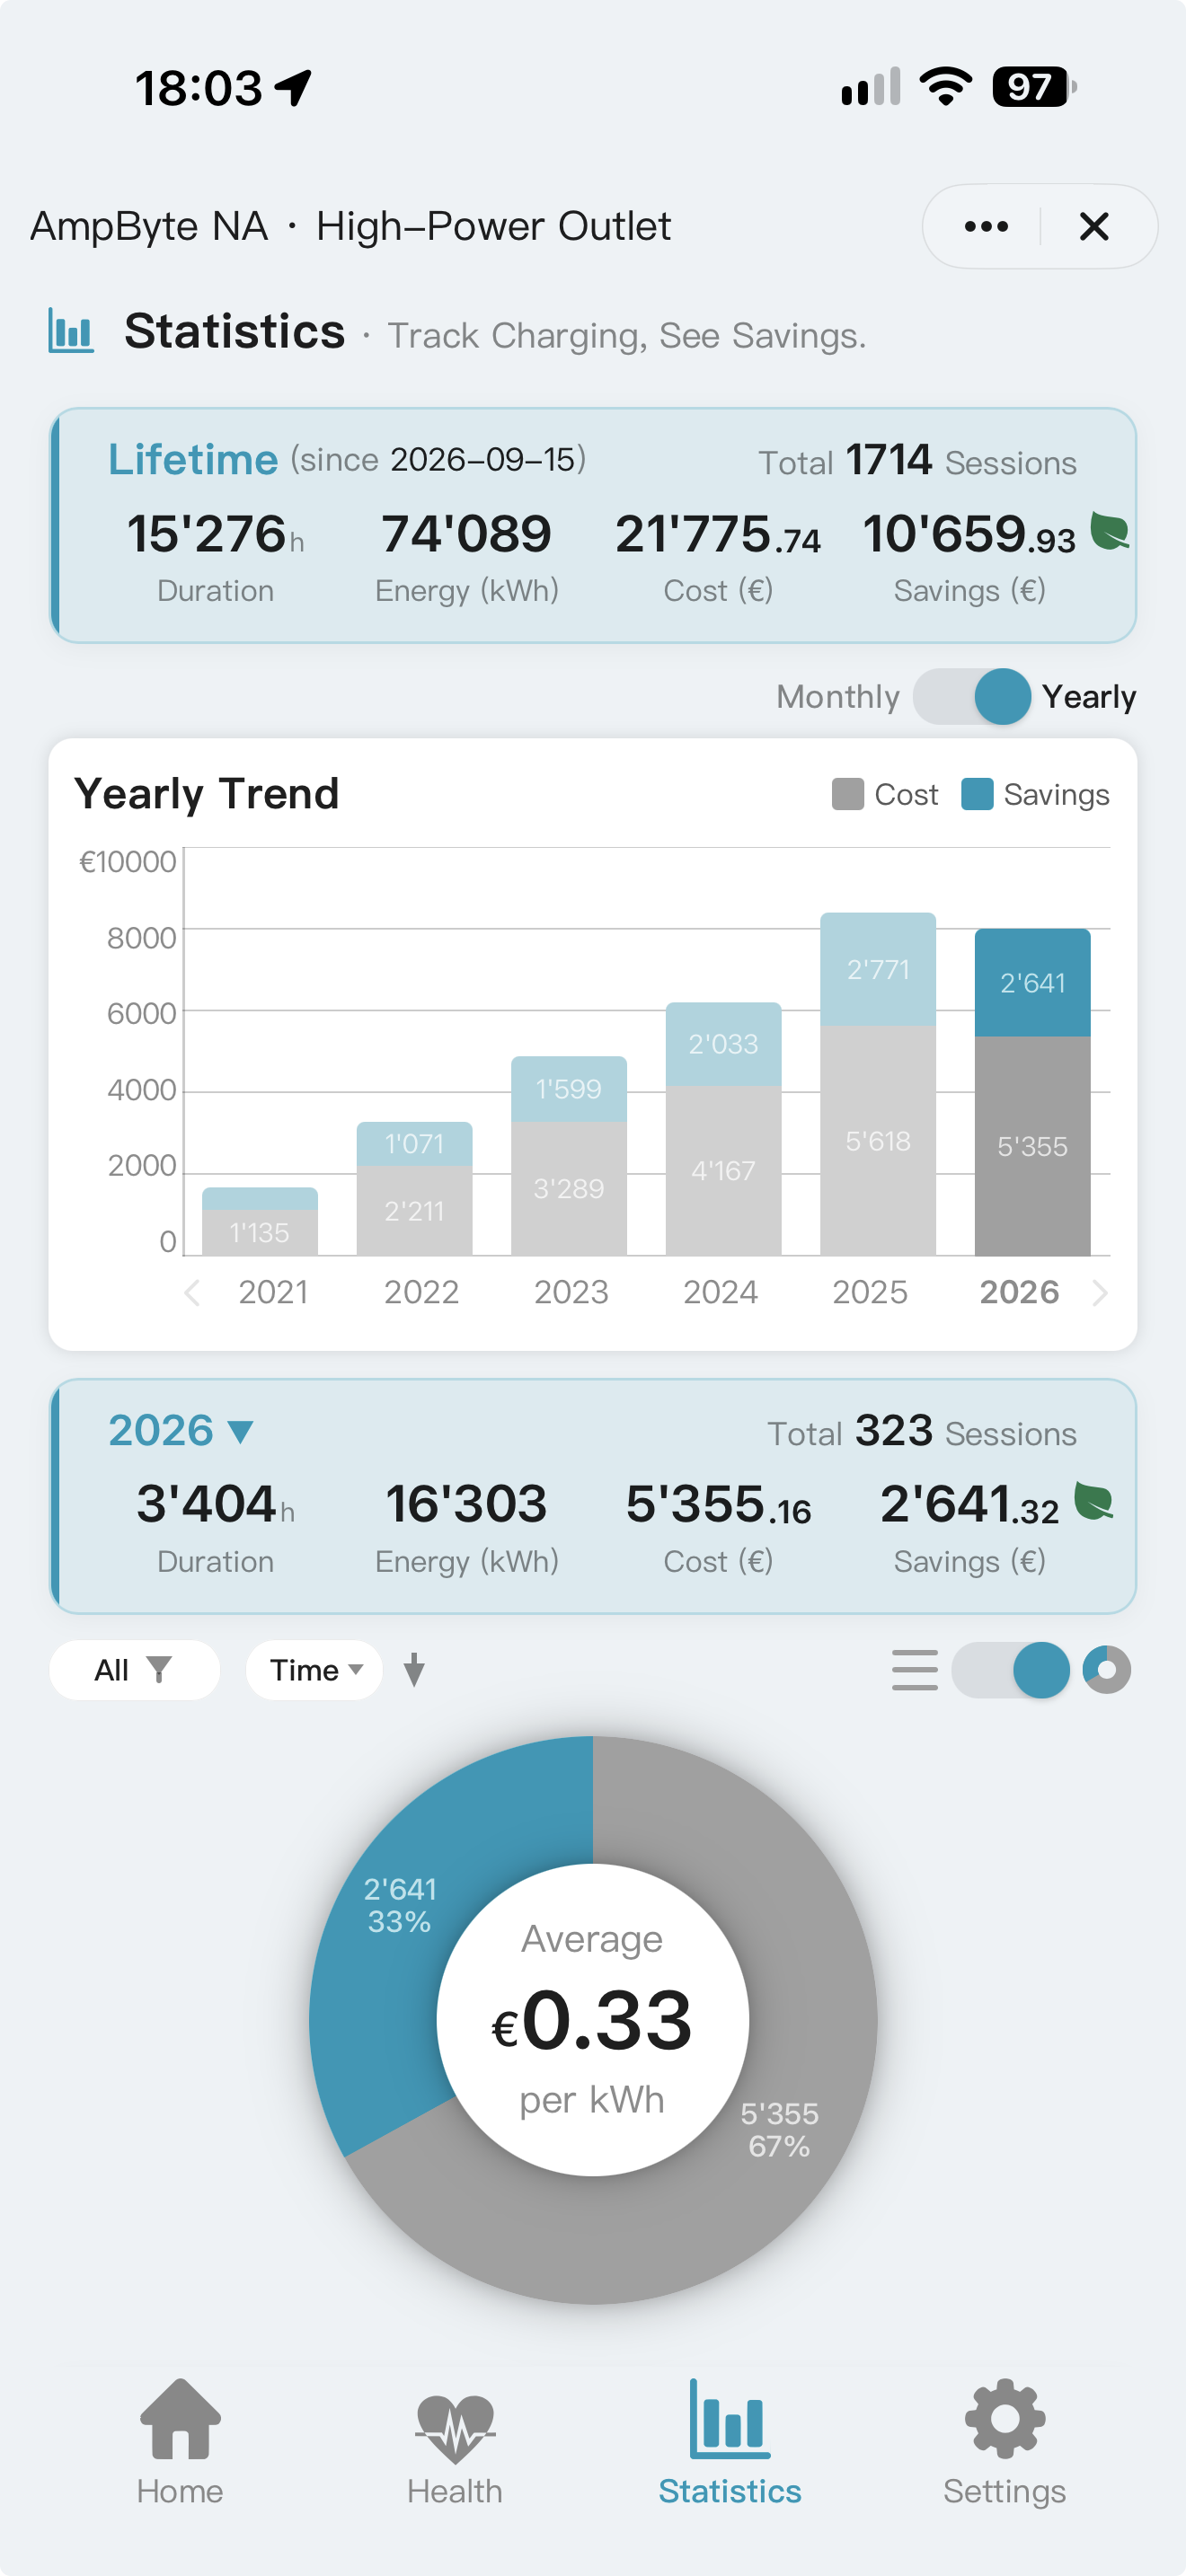
SmartApp yearly charging cost and savings with percentage breakdown

YEARLY VIEW

Your Charging.
The Bigger Picture.

Compare cost and estimated savings across the years. See annual energy use, charging time and session totals alongside your lifetime record.

The breakdown shows how cost and savings compare, with your average cost per kWh bringing the numbers into focus.

Save and share your charging report ↓
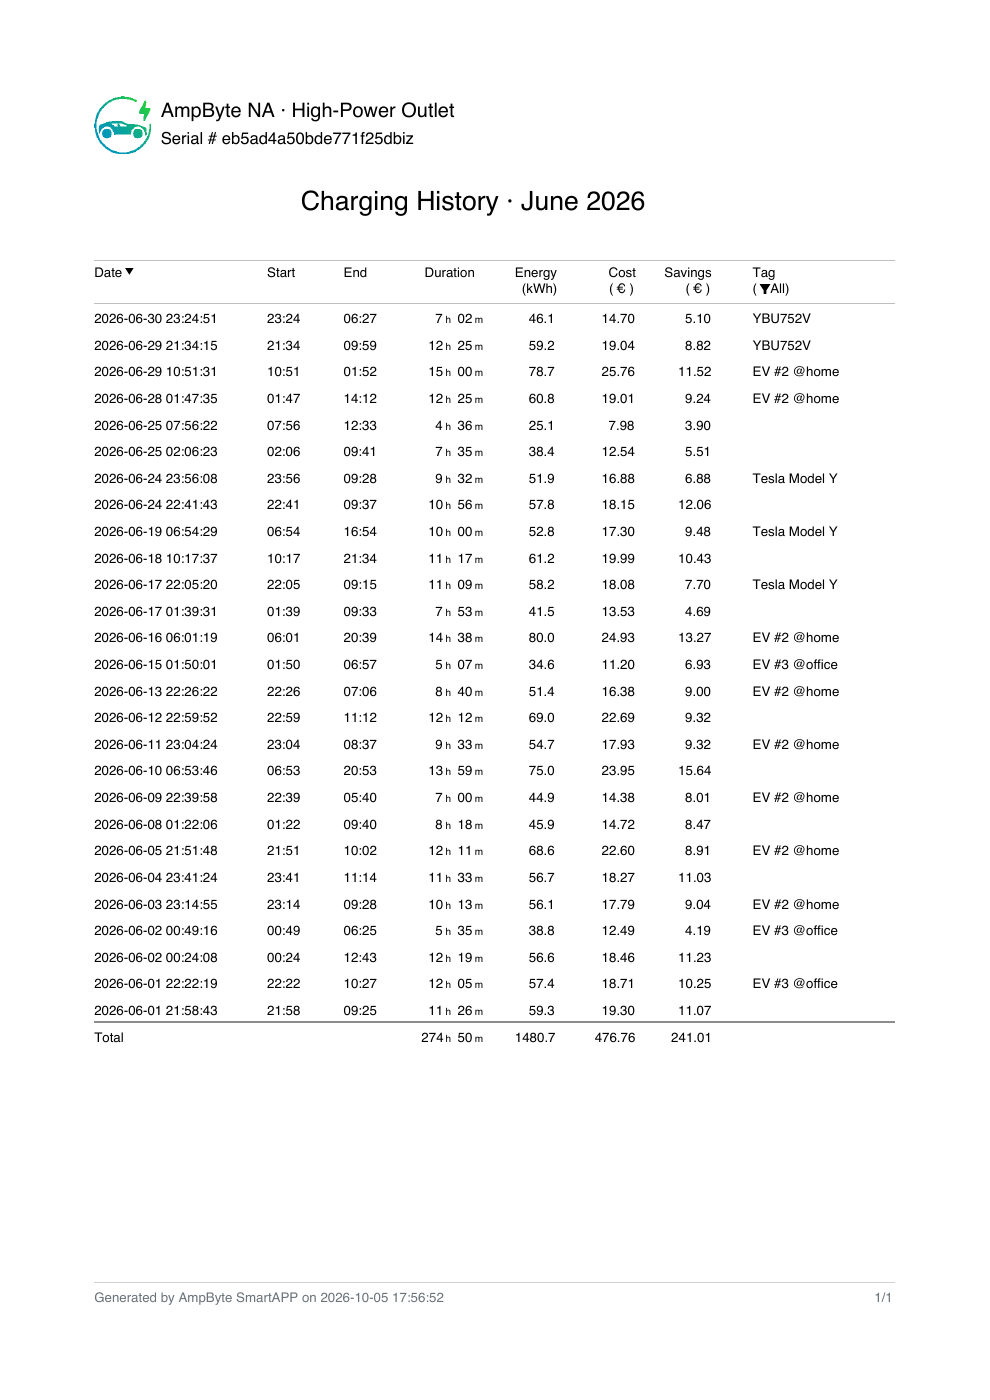
Preview of the June 2026 monthly charging report with session details and monthly totalsJune 2026 · 1-page PDF ↗

STATISTICS / EXPORT DATA

Your Monthly or Yearly Charging Report.
Ready to Share.

Export your monthly or yearly charging history as PDF or CSV to save, share or review in a spreadsheet. Review each session’s start and end times, duration, energy, estimated cost and savings—with vehicle tags and totals for your selected month or year in one clear report.

In SmartApp: Statistics → Export Data → PDF or CSV

June 2026 sample export. Cost and savings are estimates based on the configured Rate Plan.

CHARGING SAVINGS CALCULATOR

Charge at Lower Rates.
See What You Could Save.

Move more charging to cheaper hours and see the difference instantly. Try the example, or enter your own electricity prices.

  1. Enter your monthly charging energy.Find the kWh total in SmartApp Statistics.
  2. Add your two electricity prices.Use the peak and off-peak prices from your utility plan.
  3. Move the slider.Choose how much charging you can do during cheaper hours. Your savings update automatically.

Example values to get you started. Estimate covers charging energy only; fixed fees and taxes are excluded.

Try it now · change any value below

All charging at peak price
With off-peak charging
YOU COULD SAVE EACH MONTH$36

Actual results depend on your available charging window.

START WITH YOUR REAL TARIFF.

Pair once.
Make it yours.

Add your supported charger in Tuya Smart or Smart Life. Enter your own Rate Plan, then choose the charging mode that fits your day.

Based on SmartApp 2.0 User Manual, version 20260916. Features depend on charger, firmware, activation, account and market. Estimates are not utility bills; savings depend on your tariff and charging pattern.